
How to monitor trading performance on perpetual DEXs

Tracking performance on perpetual DEXs feels like flying blind. You execute trades across multiple venues, watch positions fluctuate with funding rates, and wonder if your strategies actually outperform holding spot. Without coding skills, aggregating profit and loss data becomes a manual nightmare prone to errors. This guide shows you how to prepare, execute, and verify a complete performance monitoring setup using no-code automation tools designed for execution-focused traders who want quantitative clarity without building custom dashboards.
Table of Contents
- Key takeaways
- Understanding your trading performance challenges
- Preparing your performance monitoring setup with no-code tools
- Executing performance tracking and strategy iteration
- Verifying results and benchmarking performance effectively
- Optimize your trading with Mithril Money automation
- FAQ
Key Takeaways
| Point | Details |
|---|---|
| Unified PnL across DEXs | No code tools consolidate profits and losses across multiple perpetual exchanges into a single view. |
| Benchmark with key metrics | Sharpe ratio Calmar ratio funding yield per exposure and liquidation distance help you assess risk adjusted return and capital efficiency. |
| Prioritize stable venues | Avoid DEXs with erratic volume spikes and open interest swings to keep signals clean. |
| No code data feeds | Connect exchange accounts via read only API keys to pull trade history funding payments and open positions without touching withdrawal permissions. |
| Automation with alerts | Configure threshold alerts for drawdown and funding rate anomalies to catch issues without manual monitoring. |
Understanding your trading performance challenges
Manual tracking across perpetual DEXs creates friction that slows iteration. You open positions on Hyperliquid, hedge on dYdX, and run funding arbitrage on Vertex, but each platform reports data differently. Copying numbers into spreadsheets every week invites copy-paste errors and makes it nearly impossible to spot patterns in real time.
Volatility and open interest shifts distort raw PnL if you don’t normalize metrics properly. A 5% gain during low volatility signals stronger performance than the same return during a market crash. Tracking nuanced metrics like funding yield per exposure and liquidation distance separates traders who understand true alpha from those chasing noise.
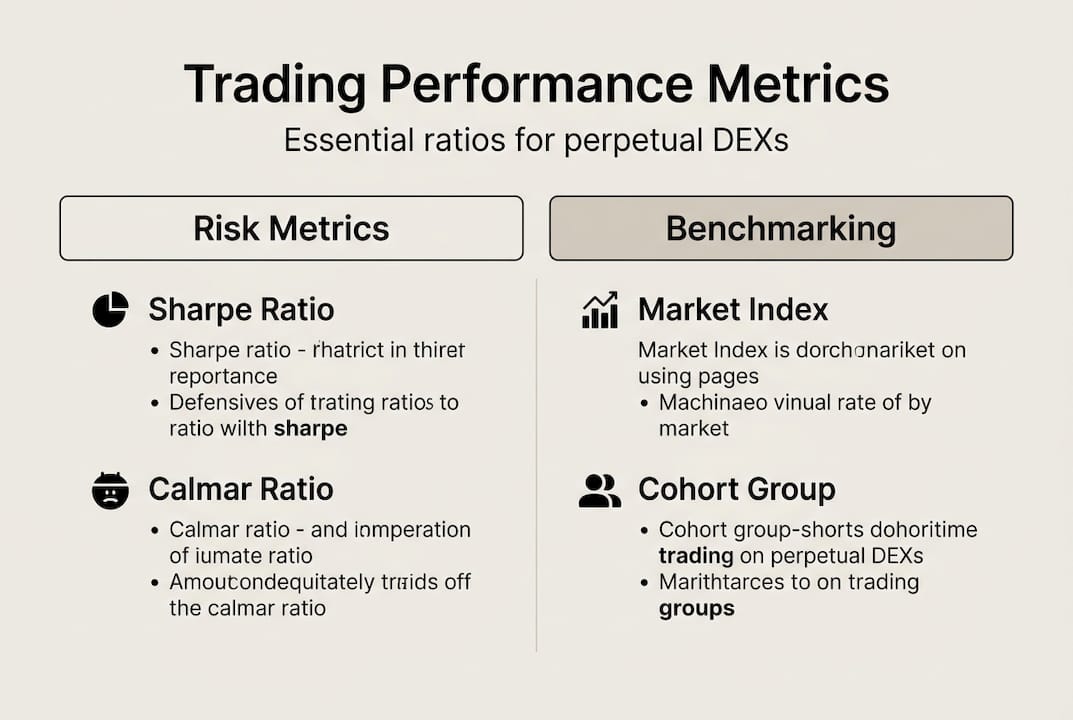
Quantitative metrics give you the language to benchmark against market indices and peer groups. Focus on these core indicators:
- Sharpe ratio measures risk-adjusted return by comparing excess return to volatility
- Calmar ratio divides annualized return by maximum drawdown to evaluate risk tolerance
- Funding yield per gross exposure (FYpGE) shows cost or income from perpetual contracts relative to position size
- Liquidation distance reveals how much price movement separates you from forced exit
Avoid DEXs with erratic volume spikes and open interest swings when building your monitoring stack. Stable venues produce cleaner signals and let you isolate strategy performance from market chaos. Explore the automated trading guide to see how execution quality impacts these metrics directly.
Preparing your performance monitoring setup with no-code tools
Choosing tools that require zero coding unlocks performance tracking for traders who think in strategies, not Python scripts. Coinrule and GoodCryptoX support multiple DEXs with unified dashboards that aggregate PnL automatically. HyperTracker specializes in cohort benchmarking for Hyperliquid users, letting you compare your funding arbitrage returns against other traders in your volume tier.
Set up data feeds by connecting exchange accounts through API keys with read-only permissions. Most platforms walk you through credential generation step by step. Secure integration means your tools pull trade history, funding payments, and open positions without ever touching withdrawal permissions.
Compare features across leading no-code platforms before committing:
| Tool | DEX support | Key features | Best for |
|---|---|---|---|
| Coinrule | Hyperliquid, dYdX, Vertex | Unified PnL, automated alerts | Multi-venue traders |
| GoodCryptoX | Hyperliquid, GMX, Gains | Portfolio aggregation, risk metrics | Diversified strategies |
| HyperTracker | Hyperliquid only | Cohort analysis, leaderboard benchmarking | Hyperliquid specialists |
Tools like Coinrule and GoodCryptoX excel at no-code PnL tracking unified across DEXs, while HyperTracker offers cohort analysis specific to Hyperliquid users. Use the performance points estimator to assess how execution quality affects your overall returns.
Pro Tip: Update connection credentials and API permissions quarterly to prevent data interruptions when exchanges rotate security protocols.
Integrate alerts for threshold breaches like drawdown limits or funding rate anomalies. Automation handles the repetitive monitoring, but you define the triggers that matter for your strategy class. Check out automated trading strategies to see how execution automation pairs with performance monitoring.
Executing performance tracking and strategy iteration
Start automated monitoring by configuring your no-code bot to pull data daily. Most platforms let you set refresh intervals from hourly to weekly depending on trade frequency. Daily updates strike the right balance for most perpetual DEX strategies, capturing funding payments and position changes without overwhelming you with noise.
Schedule manual performance reviews weekly if you trade actively or monthly for slower strategies. Automation catches the obvious moves, but human review spots subtle patterns like funding rate reversals or correlation breakdowns between hedged pairs. Automation optimizes execution and monitoring but manual review refines strategies iteratively with logged triggers.
Follow this iteration workflow:
- Review automated dashboard for overall PnL and key metric trends
- Identify periods where performance deviated from expectations
- Check logged triggers to understand what caused PnL swings
- Analyze funding yield and volatility signals during anomaly periods
- Adjust strategy parameters like spread width or position sizing
- Deploy changes and monitor impact over the next review cycle
Log every trigger from your automated systems so you can trace cause and effect. When funding rates spike and your arbitrage bot closes positions early, that logged event explains the temporary PnL dip. Without logs, you’re guessing about what happened last Tuesday.
Maintain discipline by treating automation as your execution engine and your brain as the strategy optimizer. Bots execute rules perfectly but can’t adapt to regime changes or recognize when a strategy’s edge has decayed. Visit the trading automation guide for detailed setup instructions.
Pro Tip: Use visual dashboards to plot historical performance against benchmark indices so pattern recognition becomes easier during reviews.
Iterate strategies by testing one variable at a time. If you adjust both spread width and position size simultaneously, you won’t know which change drove the performance shift. Controlled iteration builds knowledge about what actually works in your specific market conditions.
Verifying results and benchmarking performance effectively
Compute your Sharpe ratio monthly by dividing average excess return by return volatility. Excess return means your strategy return minus the risk-free rate, which you can approximate using stablecoin lending rates on DeFi protocols. A Sharpe above 1.0 indicates decent risk-adjusted performance, while above 2.0 suggests strong alpha.
Calculate Calmar ratio by dividing annualized return by maximum drawdown. This metric reveals how much pain you endured to achieve your gains. A Calmar ratio above 1.0 means you earned more annually than your worst loss, signaling resilient risk management.
Quant enthusiasts compute Sharpe and Calmar ratios on personal data and compare them against 1Token indices for low-volatility funding arbitrage and long-short strategies. Benchmarking against published indices shows whether you’re capturing market beta or generating true alpha.
Use cohort analyses to measure performance relative to traders with similar capital and strategy types. HyperTracker groups Hyperliquid users by volume tier and strategy class, letting you see if your funding arbitrage outperforms peers in your bracket. Peer comparison removes the illusion that any positive return equals success.
Reference these common benchmarks:
| Metric | Meaning | Target value | Risk signal |
|---|---|---|---|
| Sharpe ratio | Risk-adjusted return | Above 1.5 | Below 0.5 suggests high volatility |
| Calmar ratio | Return vs. max drawdown | Above 1.0 | Below 0.5 indicates poor risk control |
| Funding yield per exposure | Cost/income from perpetuals | Positive for arbitrage | Negative erodes returns |
| Liquidation distance | Price buffer to forced exit | Above 15% | Below 5% signals danger zone |
Verify your data quality by cross-checking automated reports against exchange trade history monthly. Discrepancies usually stem from API sync issues or missed funding payments. Catching errors early prevents compounding mistakes in your performance analysis.
Follow these verification steps:
- Export raw trade data from each DEX and compare totals to your monitoring tool
- Recalculate key metrics manually for one sample period to validate formulas
- Check that funding payments match exchange records exactly
- Confirm open positions in your tool match actual exchange balances
- Adjust tool settings if systematic discrepancies appear
Understand which metrics indicate healthy performance and which expose hidden risks. Positive Sharpe with negative Calmar means you’re taking drawdowns too large for your returns. High funding yield with shrinking liquidation distance signals you’re overleveraged chasing income. Learn more about strategy optimization process to refine your approach systematically.
Benchmark against multiple references to avoid anchoring bias. Comparing only to market indices might make a mediocre strategy look good during bull runs. Adding peer cohort and historical self-comparison gives you three perspectives on whether you’re actually improving. Explore crypto quant benchmark indices and DeFi quant risk models for deeper context.
Optimize your trading with Mithril Money automation
Tracking performance matters most when you can act on insights immediately. Mithril Money combines no-code automation with built-in performance monitoring designed specifically for perpetual DEX execution. You get unified PnL tracking across venues, automated strategy deployment, and benchmarking tools that compare your results to quantitative indices without writing a single line of code.
The Mithril Money platform handles execution while you focus on strategy optimization. Use the points estimator tool to assess execution quality and identify improvement opportunities. Explore step-by-step workflows in the Mithril Bots guide to see how automation and monitoring work together seamlessly.
FAQ
How can I track my trading performance on multiple perpetual DEXs without coding?
Use unified no-code platforms like Coinrule or GoodCryptoX that connect multiple DEX accounts through API keys. These tools automate PnL aggregation and provide dashboards with key performance metrics like Sharpe ratio and funding yield. Regularly review automated reports manually to catch nuances that algorithms miss, and leverage community benchmarks to compare your performance against peer cohorts. The Mithril Bots guide walks through complete setup for perpetual DEX monitoring.
What are the key metrics for evaluating trading performance on perpetual DEXs?
Sharpe ratio measures risk-adjusted return by comparing excess return to volatility, with values above 1.5 indicating strong performance. Calmar ratio compares annualized return to maximum drawdown, showing how much pain you endured for your gains. Funding yield per gross exposure (FYpGE) reveals cost or income from holding perpetual contracts relative to position size, critical for arbitrage strategies. Liquidation distance measures how far current price sits from your forced exit point, directly affecting risk exposure.
How often should I manually review my automated trading performance?
Manual reviews work best weekly for active traders or monthly for slower strategies, focusing on anomalies, funding rate impacts, and deviations from benchmarks. Use logged triggers from your automation to pinpoint specific periods requiring deeper analysis rather than reviewing everything. Regular reviews balance automation efficiency with human strategic oversight, letting you adapt to regime changes that algorithms can’t recognize independently. Monthly reviews suffice if your strategy trades infrequently and metrics remain stable.
Can I benchmark my perpetual DEX performance against professional indices?
Yes, compare your computed Sharpe and Calmar ratios against published indices like 1Token’s funding arbitrage and long-short strategy benchmarks. These indices provide monthly performance data for common strategy classes, letting you assess whether you’re capturing market beta or generating alpha. Cohort tools like HyperTracker also let you benchmark against traders in your volume tier and strategy category. Professional benchmarking reveals whether your edge is real or just lucky timing during favorable market conditions.