
Master strategy iteration for perpetual DEX trading

Most traders believe locking in strategy parameters once is enough. That mindset costs them alpha. Perpetual DEX markets shift constantly, and static configurations fail when volatility spikes or funding rates flip. Iterative refinement through backtesting, optimization, and real-time tuning separates profitable execution from stagnation. This article walks you through the iteration process: hyperparameter optimization methods, advanced risk overlays, execution nuances on perp DEXs, and empirical benchmarks that validate what actually works.
Table of Contents
- Key takeaways
- Understanding the strategy iteration process for perpetual DEX traders
- Incorporating advanced risk management overlays to protect capital
- Navigating execution challenges and nuanced edge cases on perp DEXs
- Applying empirical benchmarks and contrasting optimizer approaches
- Explore Mithril Money’s automated trading and DeFi tools
- FAQ
Key Takeaways
| Point | Details |
|---|---|
| Iterative optimization | Backtesting validates strategies against historical data and evolutionary search balances search quality with compute efficiency compared to grid search. |
| Walk forward testing | Walk forward analysis mimics live trading by retraining and validating on sequential periods and is advised as the primary guard against overfitting on perp DEX strategies, with monthly retraining after regime shifts. |
| Risk overlays | Risk overlays act as circuit breakers with drawdown limits of fifteen to twenty five percent, correlation checks to keep concentration under sixty percent, consecutive loss pauses, and ATR based dynamic stops that adjust with volatility and regime changes. |
| Empirical gains | Empirical benchmarks show substantial out of sample gains such as 149 percent when using regime adaptive approaches. |
Understanding the strategy iteration process for perpetual DEX traders
Backtesting validates your strategy against historical data before risking capital. You simulate trades using past price action, fills, and latency to estimate potential performance. Without backtesting, you’re flying blind. The next step is hyperparameter optimization, where you systematically tune variables like entry thresholds, position sizes, and stop distances.
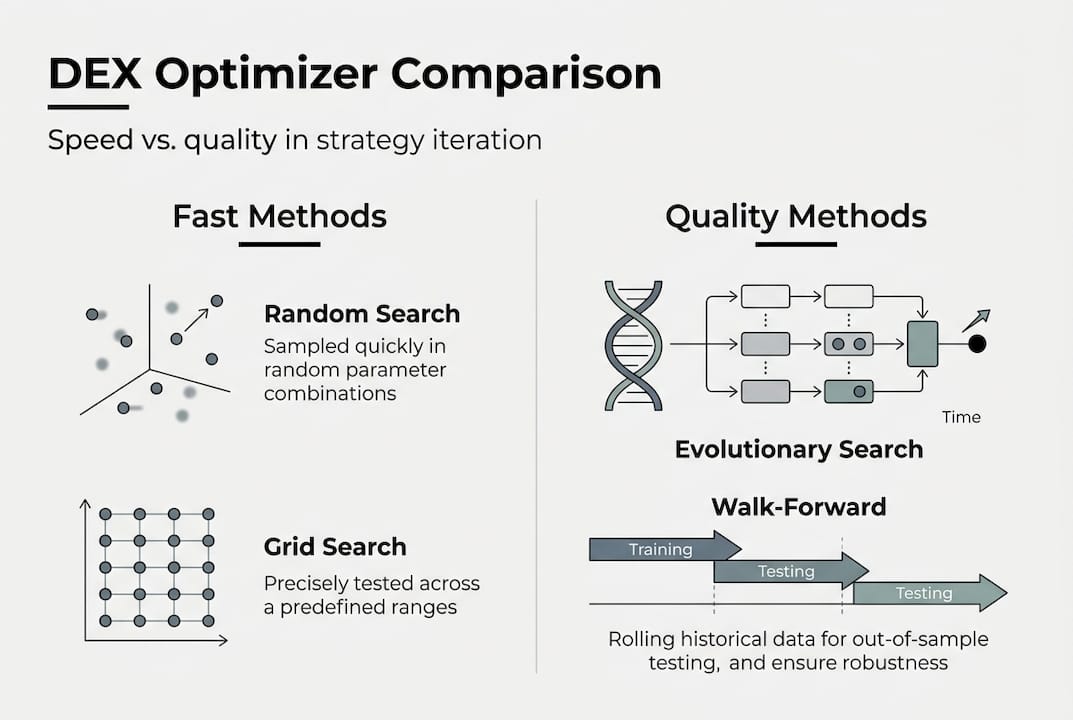
Three common optimization methods exist. Grid search tests every parameter combination exhaustively, guaranteeing the best result but consuming massive compute time. Random search samples parameter space randomly, trading precision for speed. Evolutionary search mimics natural selection, iterating on promising candidates to balance quality and efficiency. Evolutionary search matches grid search quality while slashing computational cost, making it ideal for rapid iteration cycles.
Walk-forward analysis (WFA) takes optimization further by simulating sequential retraining and testing. You optimize on a training window, validate on the next out-of-sample period, then roll forward. This mimics live trading where you periodically retune parameters as markets evolve. WFA guards against overfitting, the silent killer where strategies perform brilliantly on historical data but collapse live.
| Optimization method | Computational cost | Result quality | Best use case |
|---|---|---|---|
| Grid search | Very high | Optimal | Small parameter spaces |
| Random search | Low | Good | Quick prototyping |
| Evolutionary | Moderate | Near-optimal | Production strategies |
| Bayesian | Moderate to high | Excellent | Complex landscapes |
Practical iteration involves cycling through testing, tuning, and validating live delays and fills. Perp DEX execution differs from centralized exchanges due to on-chain latency, oracle updates, and liquidity fragmentation. Your backtest must account for realistic fill assumptions, slippage models, and transaction costs. Check your backtest performance metrics regularly to catch parameter drift before it erodes returns.
Pro Tip: Use walk-forward testing as your primary guard against overfitting on perp DEX strategies. Retrain monthly or after significant regime shifts to keep parameters aligned with current market behavior.
Incorporating advanced risk management overlays to protect capital
Risk overlays act as circuit breakers between your strategy logic and live execution. Portfolio drawdown limits cap maximum loss at a fixed percentage, typically 15% to 25% of total capital. When hit, the system pauses all strategies until you manually review and reset. This simple rule prevents catastrophic drawdowns that destroy accounts during flash crashes or cascading liquidations.

Correlation tracking monitors how your open positions move together. If you’re running multiple strategies that all go long volatility or short funding, you’ve built hidden concentration risk. Maintaining max concentration below 60% helps avoid correlated liquidation cascades where one adverse move kills your entire portfolio.
Consecutive loss pause rules halt trading after a streak of losing trades, signaling potential regime change or strategy breakdown. Dynamic stop-loss based on Average True Range (ATR) adapts risk limits to current volatility. In calm markets, stops tighten to lock in gains. During volatility spikes, stops widen to avoid premature exits on noise.
Regime detection layers analyze volatility, sentiment, and liquidity to classify market states. You then apply different risk parameters per regime. High volatility regimes get tighter position sizing and wider stops. Low volatility regimes allow larger size with tighter stops. AI sentinels like Remora act as circuit breakers, monitoring for abnormal events and cutting risk automatically, improving drawdown by 1.55%.
- Apply portfolio drawdown caps at 20% to 25% to protect overall capital
- Track position correlation to avoid concentration risk exceeding 60%
- Implement consecutive loss pauses after 3 to 5 losing trades
- Use ATR-based dynamic stops to adapt to volatility regimes
- Deploy AI circuit breakers for anomaly detection and automatic risk reduction
Pro Tip: Combine multiple overlays to form a robust risk shield tailored to perp DEX market dynamics. No single control is bulletproof, but layered defenses catch failures others miss.
Navigating execution challenges and nuanced edge cases on perp DEXs
MEV (Miner Extractable Value) and sandwich attacks are execution risks unique to on-chain trading. Bots monitor the mempool for pending trades, front-run your order to move price against you, then back-run to profit from the slippage they created. On perp DEXs, this manifests as worse fills than expected, eroding strategy returns.
MEV protection with Jito bundles enables atomic transaction execution. Your order bypasses the public mempool and executes in a private bundle, invisible to front-runners until confirmed. Private relays like Jito or Flashbots reduce MEV exposure significantly, especially for larger position sizes.
Funding rate arbitrage involves hedging perp positions with spot to exploit positive funding rates above 0.03% annualized. You go long spot, short perp, and collect funding payments with minimal directional risk. This strategy requires tight execution to capture rate differentials before they collapse. Iteration focuses on entry timing, hedge ratios, and exit triggers when rates compress.
Oracle slippage bounds protect from inaccurate price feeds affecting executions. Perp DEXs rely on oracles like Pyth or Chainlink for mark prices. During volatility, oracle updates lag spot prices, creating execution risk. Set maximum acceptable slippage thresholds and reject fills that exceed them.
High leverage up to 100x requires fast decision-making frameworks to avoid liquidation cascades. Leverage amplifies both gains and losses, and perp DEXs liquidate positions rapidly when margin falls below maintenance levels. Dynamic speed limits and liquidity monitoring are essential to survive volatility spikes.
- Use atomic bundles and private relays to mitigate MEV and sandwich attacks
- Deploy funding rate arbitrage when rates exceed 0.03% with tight hedge ratios
- Set oracle slippage bounds to reject fills during stale price feeds
- Monitor liquidity depth and adjust position sizing to avoid slippage
- Implement dynamic leverage limits based on volatility regime
These execution nuances connect back to iterative tuning. Your strategy iteration techniques must account for MEV costs, funding rate volatility, and liquidation risk in backtest assumptions. Strategies that ignore these factors perform well in simulation but fail live.
Applying empirical benchmarks and contrasting optimizer approaches
Empirical data validates which optimization methods and parameter sets actually work. Walk-forward analysis based regime-adaptive grid strategies outperform static grids by +149% out-of-sample (OOS) with a Sortino ratio of 2.87. This means the strategy delivered superior returns while limiting downside volatility, the holy grail of risk-adjusted performance.
Random search is faster but less precise, often missing optimal parameter regions. Evolutionary search offers better balance of speed and quality than Bayesian methods, which struggle with high-dimensional parameter spaces. Dynamic grids adapt spacing and bounds to market conditions, yielding superior returns to static grid layouts that ignore regime shifts.
Sharpe ratios around 0.8 to 2.3 demonstrate viable risk-adjusted performance for perp DEX strategies. These ratios account for volatility and drawdown, not just raw returns. Fill rates post-tuning average 65% for market makers like Hummingbot, a critical practical metric often ignored in backtests.
| Optimizer type | Speed | Quality | Computational cost | Best for |
|---|---|---|---|---|
| Grid search | Slow | Optimal | Very high | Small spaces |
| Random search | Fast | Good | Low | Prototyping |
| Evolutionary | Moderate | Near-optimal | Moderate | Production |
| Bayesian | Moderate | Excellent | High | Complex landscapes |
WFA-validated parameter sets reduce overfitting risk and improve live performance. You train on historical data, validate on unseen periods, and only deploy configurations that generalize. This discipline prevents the common trap of over-optimizing to past data that never repeats.
- WFA regime grids achieved +149% OOS returns with Sortino 2.87
- Evolutionary optimizers deliver Sharpe 0.82, close to grid search results
- Dynamic grids outperform static layouts by adapting to regime shifts
- Fill rates of 65% post-tuning are realistic for market making strategies
- Sharpe ratios of 0.8 to 2.3 indicate viable risk-adjusted performance
Pro Tip: Prioritize WFA-validated parameter sets to reduce overfitting risk and improve live performance. Only deploy strategies that maintain positive Sharpe ratios across multiple out-of-sample windows.
Review your backtest performance metrics after each optimization cycle. Compare in-sample to out-of-sample results. If in-sample Sharpe is 3.0 but OOS drops to 0.5, you’ve overfit. Tighten your WFA windows and simplify the strategy.
Explore Mithril Money’s automated trading and DeFi tools
Iterating strategies manually across multiple perp DEXs is tedious. Mithril Money automates the entire loop: opportunity discovery, execution, and iteration. You identify setups using scanners and AI-assisted analysis, deploy bots with built-in risk controls, then tune parameters in real time without touching code.

Mithril handles execution nuances like MEV protection, funding rate hedging, and dynamic stop-loss while you retain full custody of funds on the exchange. No black-box signals, no custodial risk. Access backtest performance metrics to validate configurations before going live, and follow strategy iteration techniques to refine your approach. Explore automated trading strategies and DeFi tools to turn your trading ideas into live execution in seconds.
FAQ
What is walk-forward analysis and why is it important?
Walk-forward analysis simulates sequential retraining and testing on rolling time windows, mimicking how you’d optimize live. It validates that your strategy generalizes to unseen data rather than overfitting to historical patterns. WFA is the gold standard for avoiding backtest illusions.
How do risk overlays improve strategy longevity?
Risk overlays like drawdown caps, correlation tracking, and consecutive loss pauses act as circuit breakers that halt trading before catastrophic losses. They protect capital during regime shifts and anomalies that your strategy wasn’t designed to handle. Layered defenses catch failures single controls miss.
What is MEV and how can I protect my perp DEX trades?
MEV (Miner Extractable Value) occurs when bots front-run your pending orders to profit from slippage they create. Protect yourself by using atomic bundles and private relays like Jito, which bypass the public mempool and execute transactions invisibly until confirmed.
Which optimizer should I start with for quick iteration?
Start with evolutionary search. It balances speed and quality, delivering near-optimal results at moderate computational cost. Random search is faster but misses optimal regions. Grid search is exhaustive but impractical for large parameter spaces.
Can AI and LLMs replace traditional optimization methods?
AI and LLMs assist with regime detection, anomaly identification, and parameter suggestions, but they don’t replace systematic optimization. Use AI as a circuit breaker or assistant, not a black box. Traditional methods like WFA remain essential for validation and avoiding overfitting.