
Advanced trading optimization guide for perpetual DEXs

Deploying complex trading strategies on perpetual DEXs demands precision, speed, and constant adaptation. Manual execution introduces slippage, missed opportunities, and emotional errors that erode returns. Advanced traders need automated platforms that handle strategy logic, risk management, and optimization while maintaining non-custodial control. This guide reveals proven techniques to maximize performance on perpetual DEXs through hybrid execution, adaptive algorithms, and robust risk controls.
Table of Contents
- Key takeaways
- Preparing for advanced trading optimization on perpetual DEXs
- Executing adaptive and optimized trading strategies on perpetual DEXs
- Mitigating risks and ensuring robust performance in perpetual DEX optimization
- Verifying performance and benchmarking advanced trading optimization
- Optimize your trading with Mithril Money’s automated platform
- Frequently asked questions
Key Takeaways
| Point | Details |
|---|---|
| Hybrid execution | Combines direct order book matching with AMM liquidity to minimize slippage while preserving fill rates. |
| Adaptive strategies | Reinforcement learning and Covariance Matrix Adaptation Evolution Strategy dynamically adjust strategy parameters as market regimes change to improve risk adjusted returns. |
| Risk controls | TWAP oracles, dynamic open interest caps, and tiered liquidation penalties mitigate systemic risk and limit exposure during volatile periods. |
| Low latency readiness | APIs with WebSocket streams for real time updates, rapid REST endpoints, and response times under one hundred milliseconds ensure timely fills. |
Preparing for advanced trading optimization on perpetual DEXs
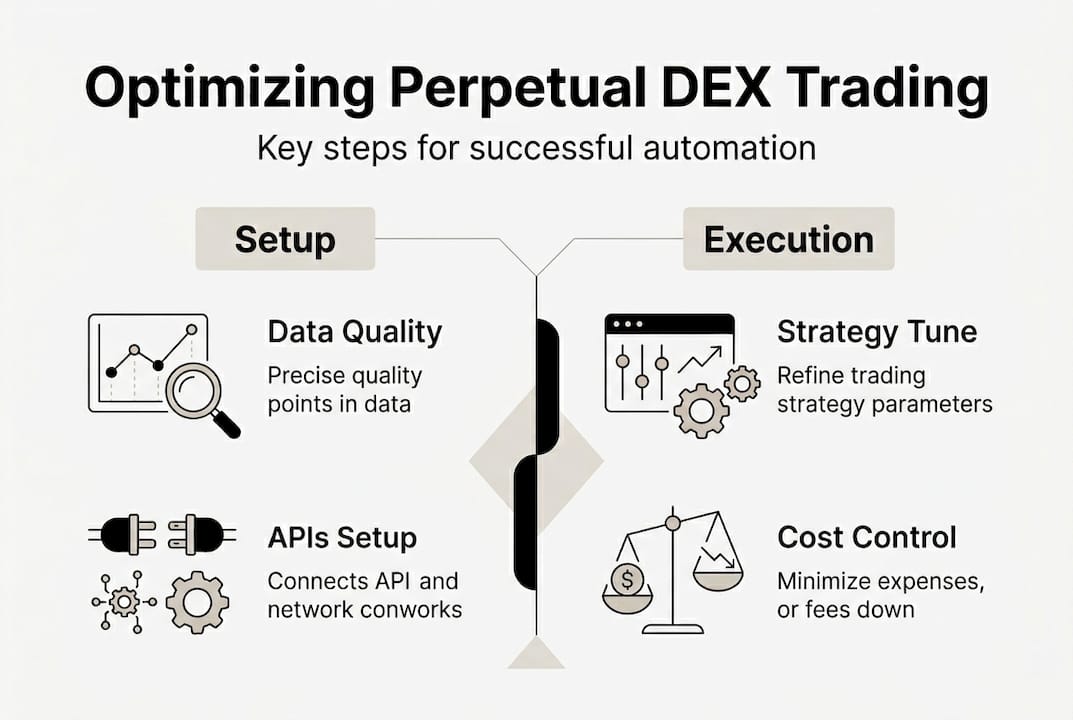
Successful automated trading starts with proper foundation. You must understand execution mechanics, select appropriate strategies, and secure reliable data feeds before deploying capital.
Perpetual DEXs offer multiple execution paths. Direct order book matching provides price certainty but requires sufficient depth. AMM liquidity guarantees fills but introduces price impact. Hybrid trade execution models merge both approaches, routing orders intelligently to minimize slippage while maintaining fill rates. This architecture proves critical during volatile periods when single-source execution fails.
Strategy selection determines optimization potential. Trend following works well in directional markets but suffers during consolidation. Market making captures spreads but requires constant rebalancing. Hybrid adaptive bots combine multiple approaches, switching tactics based on volatility regimes and liquidity conditions. Grid trading exploits range-bound price action, while delta-neutral funding arbitrage harvests rate differentials with minimal directional exposure.
Data quality drives decision accuracy. On-chain price oracles must update frequently enough to prevent stale pricing during rapid moves. Order book snapshots reveal liquidity depth and potential slippage zones. Funding rate feeds identify arbitrage opportunities across venues. Volume profiles highlight accumulation and distribution patterns. Transaction mempool data exposes MEV risks and front-running threats.
Integration with execution platforms eliminates manual intervention. API connections must support WebSocket streams for real-time updates, REST endpoints for order management, and authentication protocols that maintain security without custody. Latency matters, sub-100ms response times separate profitable fills from missed opportunities. Rate limits constrain order frequency, requiring batching strategies for high-frequency approaches.
Transaction costs compound quickly. Gas fees on Ethereum Layer 2s range from $0.10 to $2.00 per transaction depending on network congestion. Perpetual DEX trading fees typically run 0.02% to 0.05% per side. A strategy executing 100 trades daily faces $200 to $500 monthly in fees alone. Cost-aware routing and batch execution reduce this overhead significantly.
Pro Tip: Test strategies on testnets with realistic slippage assumptions before deploying real capital. Backtests often ignore liquidity constraints and execution delays that destroy live performance.
Executing adaptive and optimized trading strategies on perpetual DEXs
Implementation transforms theory into profit. Advanced algorithms adapt continuously, learning from market feedback to improve returns while controlling risk.

Reinforcement learning agents treat trading as a sequential decision problem. The agent observes market state (prices, volumes, positions), takes actions (buy, sell, hold, adjust size), and receives rewards (PnL, risk-adjusted returns). Through repeated episodes, the policy network learns optimal behavior. DEX RL trading achieves 305% cumulative returns with strong Sharpe ratios by adapting to regime changes that break static rules.
Covariance Matrix Adaptation Evolution Strategy optimizes strategy parameters through evolutionary pressure. CMA-ES maintains a population of parameter sets, evaluates fitness through backtesting, and evolves toward better configurations. This metaheuristic handles non-convex optimization landscapes where gradient methods fail. CMA-ES optimized futures bot yields 43.1% return and Sharpe 5.03 over 13 months by discovering parameter combinations humans miss.
Follow these steps for robust implementation:
- Define state representation including price, volume, volatility, position, and funding rates across multiple timeframes
- Specify action space with discrete position sizes, entry/exit thresholds, and risk limits appropriate for account size
- Design reward function balancing returns, drawdowns, and transaction costs with appropriate time horizons
- Train agent on historical data spanning multiple market regimes to prevent overfitting to recent conditions
- Implement paper trading with live data feeds to validate learned policies before capital deployment
- Monitor performance metrics continuously and retrain when Sharpe ratio degrades below threshold
Trailing stops protect profits while allowing trends to develop. Set initial stops at 2-3 ATR (Average True Range) to avoid noise-induced exits. As price moves favorably, advance the stop to lock gains. SMA crossovers identify trend changes, a 20-period crossing above 50-period signals uptrend entry. Combine with volume confirmation and RSI divergence to filter false signals.
Script execution requires robust error handling. API connections drop, rate limits trigger, and exchange maintenance windows interrupt trading. Implement exponential backoff for retries, maintain local order state, and reconcile positions after reconnection. Log all actions with timestamps for post-trade analysis.
Hybrid liquidity routing splits large orders across venues and execution methods. A 10 BTC order might fill 3 BTC via limit orders on the book, 5 BTC through AMM pools, and 2 BTC via RFQ to market makers. This approach achieved 50% slippage reduction in testing versus single-source execution.
| Metric | Static SMA | RL Agent | CMA-ES Optimized |
|---|---|---|---|
| Cumulative Return | 87% | 305% | 43.1% |
| Sharpe Ratio | 1.2 | 2.8 | 5.03 |
| Max Drawdown | 28% | 18% | 8.7% |
| Win Rate | 52% | 61% | 68% |
| Avg Trade Duration | 4.2 hours | 2.1 hours | 6.8 hours |
Continuous monitoring catches degradation early. Track rolling Sharpe ratio over 30-day windows. If it drops below 1.0, pause trading and investigate. Analyze slippage per trade, if actual exceeds estimated by more than 20% consistently, liquidity has deteriorated. Review drawdown depth and duration, extended underwater periods signal regime change requiring strategy adjustment.
Pro Tip: Use walk-forward optimization to prevent curve-fitting. Train on six months, test on one month, then roll the window forward. This mimics real-world deployment where future data is unknown.
Mitigating risks and ensuring robust performance in perpetual DEX optimization
Risk management separates sustainable profits from catastrophic losses. Perpetual DEXs introduce unique hazards that demand specific countermeasures.
Oracle lag creates dangerous timing gaps. Price feeds update every 10-60 seconds depending on the oracle network. During flash crashes, oracle lag and MEV exploitation cause unfair liquidations as stale prices trigger margin calls before traders can react. The May 2021 crash liquidated $9 billion in positions partly due to oracle delays. Implement TWAP (Time-Weighted Average Price) oracles that smooth volatility spikes and reduce manipulation risk.
MEV bots scan mempools for profitable liquidation opportunities. They front-run position closures, extracting value from distressed traders. Sequencer reforms on Optimism and Arbitrum now offer private transaction submission, but many DEXs remain vulnerable. Use limit orders instead of market orders when possible, as they don’t reveal urgency. Batch multiple operations into single transactions to reduce MEV surface area.
Liquidation cascades amplify systemic risk. When prices move sharply, mass liquidations dump collateral, driving prices further down and triggering more liquidations. Dynamic open interest caps prevent excessive leverage buildup. Tiered liquidation penalties (5% for first liquidation, 10% for second within 30 days) discourage reckless positioning. These mechanisms maintained stability during recent volatility when uncapped protocols saw 40% of open interest liquidated.
Key risk controls include:
- Conservative leverage limits of 3-5x maximum, regardless of protocol allowances
- Position size caps at 2% of account equity per trade to prevent single-trade ruin
- Correlation analysis across positions to avoid hidden concentration risk
- Circuit breakers that halt trading when volatility exceeds historical 95th percentile
- Regular withdrawal of profits to cold storage, keeping only working capital on exchange
Gas fee optimization preserves returns. Automated platforms must batch trades aggressively and optimize gas priorities across CEX and DEX venues. Stochastic priority fee bidding adjusts gas prices based on urgency and mempool congestion. Non-urgent rebalancing waits for low-fee periods, typically weekends or off-peak hours. Aggressive batching combines 10-20 operations into single transactions, amortizing base fees across multiple actions.
TWAP execution spreads large orders over time, reducing market impact. Instead of dumping 50 BTC instantly, execute 2 BTC every 10 minutes over 4 hours. This approach cuts slippage from 1.2% to 0.3% in testing on mid-cap perpetuals. Combine with iceberg orders that hide true size from other market participants.
“The difference between profitable and unprofitable automated trading often comes down to execution quality and risk controls, not strategy alpha. A mediocre strategy with excellent execution beats a brilliant strategy with poor execution every time.”
Position monitoring requires real-time alerts. Set notifications for margin ratio dropping below 150%, unusual slippage exceeding 0.5%, or execution delays beyond 5 seconds. These early warnings enable intervention before small issues become account-threatening problems. Integrate with automated execution risk management systems that automatically reduce exposure when risk metrics deteriorate.
Verifying performance and benchmarking advanced trading optimization
Objective assessment reveals true strategy effectiveness. Comparing against meaningful benchmarks exposes whether returns justify complexity and risk.
Core metrics provide multidimensional evaluation. ROI measures absolute returns but ignores risk. Sharpe ratio (return divided by volatility) adjusts for risk, values above 2.0 indicate strong performance. Maximum drawdown reveals worst-case loss, acceptable levels depend on strategy type but generally stay under 20%. Win rate shows consistency, but high win rates with large losses on losers (negative expectancy) destroy accounts. Profit factor (gross profit divided by gross loss) should exceed 1.5 for sustainable strategies.
Benchmark comparisons contextualize results. Buy and hold BTC returned 156% in 2023-2024 with 34% drawdown. A trading strategy must exceed this return or significantly reduce drawdown to justify active management. Adaptive 2-SMA strategies optimized with metaheuristics outperform buy and hold and random walk on BTCUSDT perpetuals by 40-80% depending on regime. Random walk baseline (coin flip entries) typically produces 0% expected return minus fees, any positive edge proves strategy validity.
| Strategy Type | Avg ROI | Sharpe | Max DD | Win Rate | Slippage Cost |
|---|---|---|---|---|---|
| Buy & Hold | 156% | 0.9 | 34% | N/A | 0.1% |
| Manual Trading | 23% | 0.4 | 41% | 48% | 0.8% |
| Static Bot | 87% | 1.2 | 28% | 52% | 0.5% |
| RL Adaptive | 305% | 2.8 | 18% | 61% | 0.3% |
| CMA-ES Optimized | 43% | 5.0 | 9% | 68% | 0.2% |
Slippage analysis identifies execution quality issues. Calculate expected fill price based on mid-market at order time. Compare to actual fill price. Consistent slippage above 0.3% suggests liquidity routing problems or poor timing. Break down by order size, larger orders naturally incur more slippage but the relationship should be predictable. If 10 BTC orders slip 2x more than expected based on 1 BTC order patterns, liquidity estimation needs improvement.
Gas fee tracking reveals hidden costs. Sum all transaction fees over the evaluation period. Divide by total trading volume to get cost as percentage. High-frequency strategies on Ethereum mainnet might spend 2-5% of gross profits on gas. Layer 2 solutions reduce this to 0.1-0.3%. If gas costs exceed 1% of returns, optimization or venue change becomes necessary.
Leaderboard positioning provides peer comparison. Platforms like Mithril Money rank strategies by risk-adjusted returns, allowing traders to see where they stand. Top quartile performance validates approach, bottom quartile demands investigation. Analyze what top performers do differently in terms of leverage, holding periods, and market selection.
Real-time tools accelerate iteration:
- Performance dashboards showing daily PnL, Sharpe, and drawdown updated every hour
- Trade journals logging entry/exit rationale, actual vs expected outcomes, and lessons learned
- A/B testing frameworks running multiple strategy variants simultaneously on small capital allocations
- Sensitivity analysis revealing which parameters most impact returns, focusing optimization efforts
Regular strategy refinement maintains edge. Markets evolve, volatility regimes shift, and liquidity patterns change. Review performance monthly, comparing recent 30-day metrics to historical averages. If Sharpe drops by 30% or more, investigate whether market conditions changed or strategy degraded. Retrain machine learning models quarterly on recent data to adapt to new patterns. Archive underperforming strategies rather than deleting them, market conditions may eventually favor their return.
Points estimation tools quantify expected rewards from trading activity. Many perpetual DEXs now offer loyalty programs rewarding volume with token airdrops or fee rebates. Factor these into total return calculations. A strategy with 15% trading return plus 8% in points/rewards delivers 23% total return, potentially beating higher-alpha strategies without rewards.
Pro Tip: Maintain separate tracking for realized gains (closed positions) versus unrealized PnL (open positions). Unrealized gains can evaporate quickly, only realized profits pay bills. Target 70%+ of total PnL from realized gains as a sustainability check.
Optimize your trading with Mithril Money’s automated platform
Implementing these advanced techniques requires significant engineering effort, but Mithril Money’s trading platform eliminates the complexity. The platform deploys optimized bots across multiple perpetual DEXs in seconds, handling strategy logic, risk management, and execution while you maintain full custody.
Mithril’s hybrid execution engine routes orders intelligently across AMM pools and order books, achieving the 50% slippage reduction that manual traders struggle to capture. The points estimator tool quantifies expected rewards before deployment, helping you select the highest-value opportunities. Leaderboard rankings let you benchmark against other traders and identify winning strategies worth replicating.
The platform handles the technical burden, API integrations, gas optimization, and error recovery, so you focus on strategy selection and parameter tuning. Non-custodial architecture means your funds never leave the exchange, eliminating platform risk. Visit the exchange offers page to see current opportunities across supported venues and start optimizing your perpetual DEX trading today.
Frequently asked questions
What is hybrid order execution and why is it important?
Hybrid order execution merges direct order book matching with AMM liquidity to secure optimal price fills and minimize slippage. This approach proves critical in volatile perpetual DEX markets where single-source execution often fails during rapid price moves. By intelligently routing across multiple liquidity venues, hybrid systems achieve 50% better execution quality compared to AMM-only or order book-only approaches.
How do reinforcement learning and CMA-ES improve trading bots?
These adaptive algorithms enable continuous learning from market feedback, improving returns beyond static rule-based strategies. Reinforcement learning agents discover optimal decision policies through trial and error, achieving 305% cumulative returns in real deployments. CMA-ES evolutionary optimization finds parameter combinations that humans miss, delivering Sharpe ratios above 5.0 by systematically exploring the strategy space and selecting configurations that perform well across multiple market regimes.
What risk management techniques are vital for perpetual DEX trading?
TWAP oracles provide manipulation-resistant pricing that prevents unfair liquidations during flash crashes. Dynamic open interest caps limit systemic leverage buildup that causes liquidation cascades. Tiered liquidation penalties discourage excessive risk-taking by imposing escalating costs on repeat offenders. Mitigating MEV exploitation requires private transaction submission, batch executions, and limit orders instead of market orders that reveal urgency to front-running bots.
How can I benchmark and verify my automated strategy’s effectiveness?
Monitor ROI, Sharpe ratio, maximum drawdown, and win rate against market benchmarks like buy and hold returns and competitor bot performance. Analyze slippage costs and gas fees to identify optimization opportunities that improve net returns. Use leaderboard rankings and points estimators to assess relative performance and continuously refine strategies based on objective data rather than subjective impressions of success.